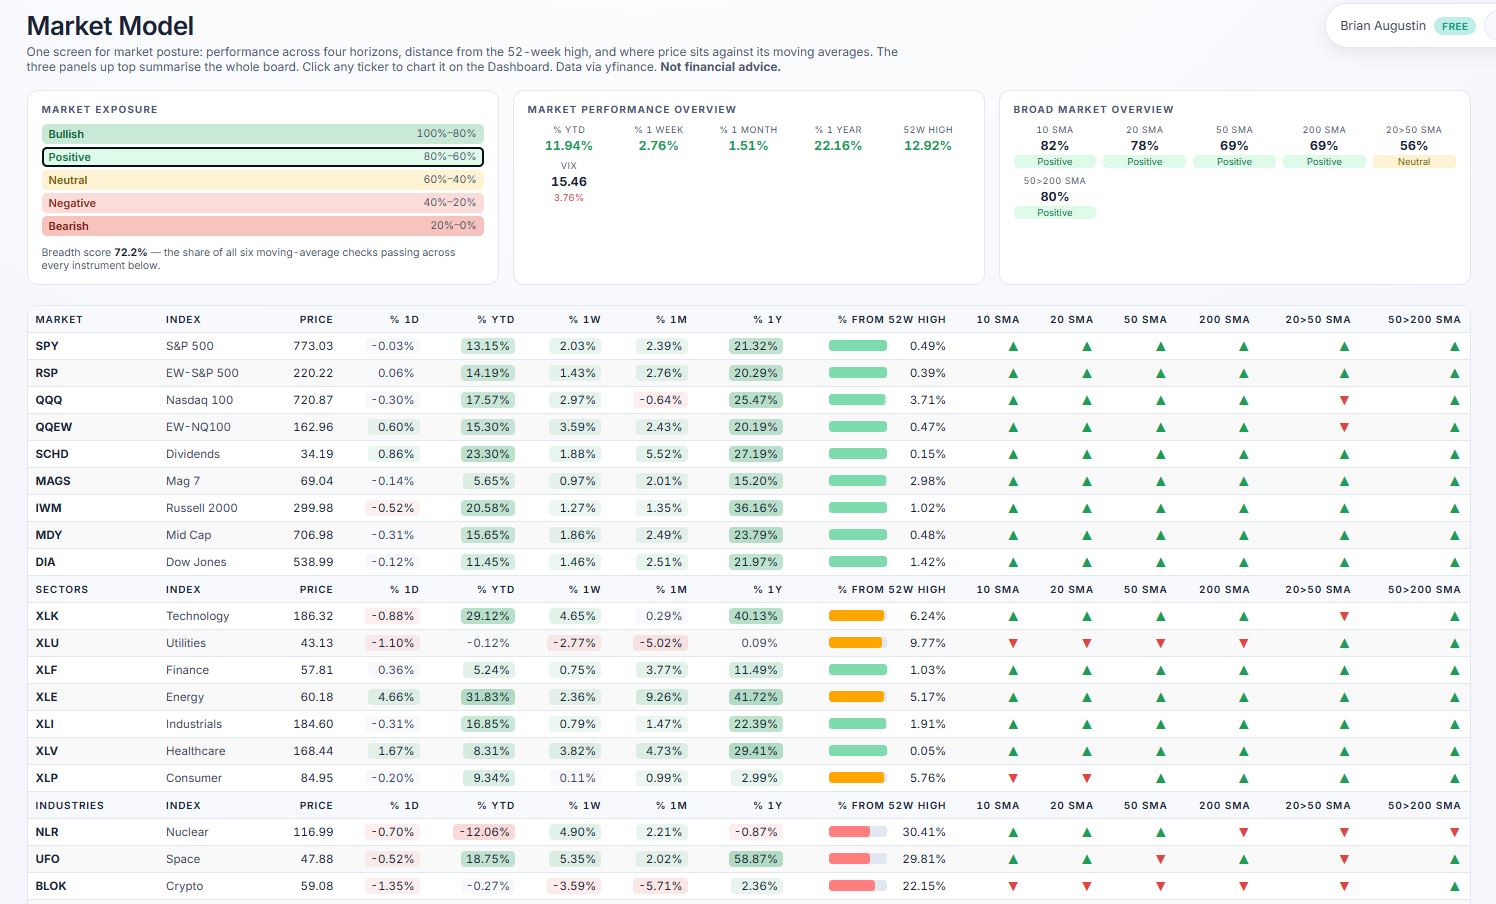
Market Model

One screen for market posture: performance across four horizons, distance from the 52-week high, and where price sits against its moving averages. The three panels up top summarise the whole board. Click any ticker to chart it on the Dashboard. Data via yfinance. Not financial advice.

Market Exposure

Market Performance Overview

Broad Market Overview

What each column means

Market Dashboard

Pick a market from the tabs, then any row in the list — the chart above follows. Drag the chart to scroll back through history and scroll to zoom; it keeps going back to the instrument's first day of trading, and forward into empty space past the latest bar. Data via yfinance. Not financial advice.

— —
Loading…

drag to scroll · scroll to zoom · double-click to reset

Tradesify
Live market data · no API key needed

Your whole market view, one workspace.

Score any stock on six weighted factors, price every contract in its option chain, and track what you actually own — cost basis, concentration and risk included. One engine, from first screen to open position.

Free to use · an account is only needed to save positions

Stock Indexes

Stock Market News

    6weighted scoring factors
    312industries mapped
    40+curated themes
    FullGreeks on every contract

    Everything in one place

    The whole toolkit for reading a company

    Most of what you need to form a view on a stock is public and free. The work is in collecting it, lining it up and keeping it current. That part is already done here.

    • Every ticker gets a scorecard. Six weighted categories, and the factors behind each one are shown rather than summarised.
    • 190 fundamental line items. Income statement, balance sheet, cash flow, margins and ratios — with a growth rate for all of them.
    • Six of them on one chart. Anything measured in the same units shares an axis, so the lines actually compare.
    • 1,242 ETFs across 54 providers. Browse by issuer or theme, then compare any two side by side on cost, size and holdings.
    • A screener you can paste into. Drop in a list of symbols and score, sort and filter the whole batch at once.
    • Watchlist and portfolio. Cost basis, unrealised P&L and concentration, with every table exportable to Excel.

    Free to use · an account is only needed to save positions

    Revenue and gross marginExample

    Twelve quarters, two units, one axis each.

    Revenue · left axis Gross margin · right axis
    190line items to chart
    6series at once, axes shared by unit

    See it in action

    The actual screens, not mockups

    Every image below is the live product. Click any one to open it full size.

    Every ticker gets a scorecard — Tradesify screenshot
    Every ticker gets a scorecardOpen any symbol for the full breakdown — the six scoring categories, the factors behind each one, and the technical read. Open full size ↗
    The screener — Tradesify screenshot
    The screenerPaste a list or load a preset, then sort, filter and score the whole batch at once. Open full size ↗
    Market Model — Tradesify screenshot
    Market ModelBreadth across 45 instruments — four performance horizons, distance from the 52-week high, and six moving-average checks. Open full size ↗
    Theme baskets — Tradesify screenshot
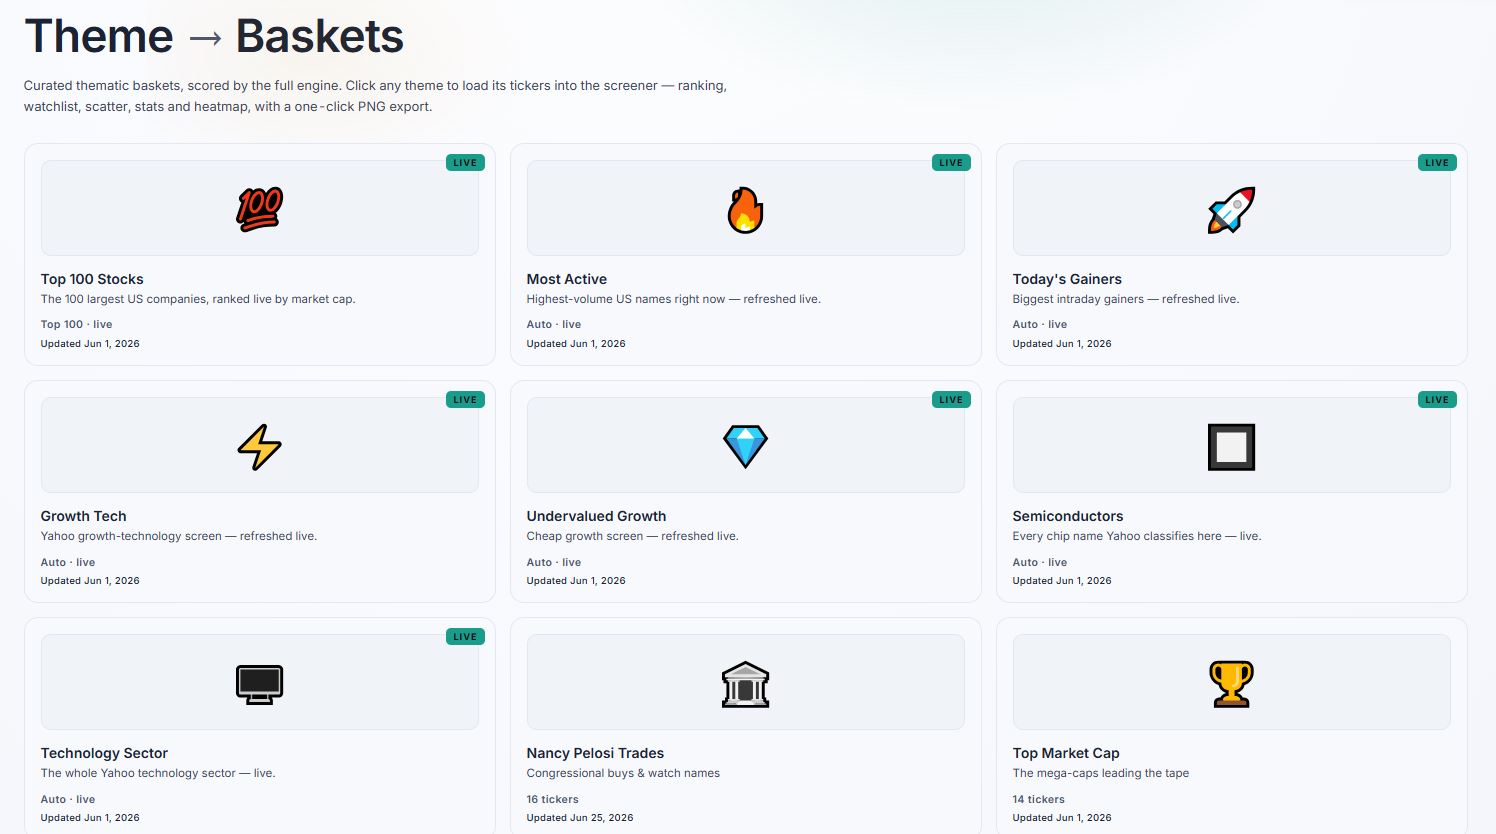
    Theme basketsReady-made lists by theme, scored the same way as anything you assemble yourself. Open full size ↗
    Public scorecards — Tradesify screenshot
    Public scorecardsPublish a scored list to the leaderboard, or read what everyone else is running. Open full size ↗
    Excel export of a scored screener list — Tradesify screenshot
    Export to ExcelTake a scored list out as a real spreadsheet — every column, ready to pivot or share. Open full size ↗

    Portfolio

    See what you actually own, not just what you watch

    A watchlist tracks curiosity. A portfolio tracks exposure. Enter shares and average cost once and Tradesify keeps the rest current — market value, unrealized gain, today's move, and whether the scoring engine still likes what you are holding.

    • ✓ Several books — taxable, retirement, paper — each with its own address and cash balance
    • ✓ Import a positions CSV straight from your broker
    • ✓ Sector and industry weights by dollar value, not ticker count

    Allocation · by sector

    Technology92.6%
    Consumer Defensive7.4%
    Cash16.7%
    Effective positions of 12 held2.3

    Stock screener

    Six factors, one weighted score — and the reasons behind it

    Growth, quality, valuation, financial health, momentum and technicals, each weighted and combined into a single composite. Hover any grade and the model shows its working: which inputs helped, which hurt, and which were missing.

    • ✓ Load a ticker list, a theme, a sector or an industry
    • ✓ Six views over the same names — ranking, charts, scatter, stats
    • ✓ Fixed, published models — no black box, no hidden tuning

    Why this grade

    NVDA · A · 88 / 100
    Revenue growth45.0%
    Return on equity38.0%
    Gross margin65.0%
    Trailing P/E55.0

    Option chain

    Every contract priced, then ranked on what the trade needs

    The full chain, priced with Black‑Scholes and scored on liquidity, breakeven, decay and convexity. Filter by expiry and delta band, then read the Greeks without exporting anything to a spreadsheet.

    • ✓ Long calls and puts ranked by setup quality, not just volume
    • ✓ Breakeven, days to expiry and theta drag shown per contract
    • ✓ Implied volatility history so today's premium has context

    Long calls · 45 DTE

    180C Sep 19Δ .5882
    190C Sep 19Δ .4788
    200C Sep 19Δ .3674
    210C Sep 19Δ .2761

    Risk & performance

    Find out when your diversification is only skin deep

    Twelve tickers can behave like two positions. Tradesify correlates your holdings on weekly returns, charts the years that went for and against you, and reports drawdown and volatility against a benchmark — so concentration shows up before it costs you.

    • ✓ Correlation heatmap that names the pairs moving as one
    • ✓ CAGR, volatility, max drawdown and return per unit of risk
    • ✓ Calendar-year bars, green for gains and red for losses

    Return by calendar year

    202020212022202320242025

    Themes & sectors

    Start from an idea, not a blank ticker box

    Forty curated themes, eleven sectors and 312 industries, each one loading straight into the screener already scored. Or open the heat map and read where money moved today, this month and this year.

    • ✓ Top 100 by market cap, refreshed live
    • ✓ Industry heat map across every sector at once
    • ✓ Publish a scorecard to the leaderboard when you want to share one

    Industry heat map · 1M

    Semiconductors+14.2%
    Utilities−3.8%

    Everything else

    The details that make it usable daily

    Small things, but they are the difference between a tool you try once and one you keep open.

    🔔

    Downgrade alerts

    A notification when the engine lowers a grade on something you hold — once, when it happens, even with the site closed.

    ⬆

    Broker CSV import

    Drop a positions export from Fidelity, Schwab, Robinhood or E*TRADE. You see exactly what it read before anything is saved.

    📊

    Six views, one dataset

    Ranking, charts, scatter, statistics, comparison and valuation — over whatever names you just loaded.

    📈

    Compare, three ways

    A rebased performance chart with a crosshair read-out, the scoring radar, and a Finviz-style ranking grid of 85 metrics — up to 30 tickers side by side.

    ⚖️

    Options and ETF look-through

    Contracts priced off the chain with Greeks in position terms, and index funds decomposed into the sector weights you actually hold.

    🧾

    Every metric, explained

    Hover any figure on a stock page for what it means and where it misleads. Export the lot — definitions included — to Excel.

    🤖

    A rating that shows its work

    Not just a grade: which factors earned points, out of how many, and whether the analyst consensus agrees or doesn't.

    📰

    Headlines, linked out

    The last five days for any ticker — date, headline, source, straight to the publisher. Titles only, never scraped article text.

    🏆

    Public scorecards

    Publish a scored list as a shareable page, or read what other people have put up on the leaderboard.

    🧭

    Sector divergence

    Where a sector's average and its leaders disagree — usually the first sign of rotation inside it.

    🌙

    Light and dark

    The whole app follows one switch, saved to your browser. No separate themes to keep in sync, no flash on load.

    How it works

    Three steps, no setup

    No API key, no data subscription, no spreadsheet to maintain.

    1

    Load some names

    Type tickers, pick a theme, or open a sector. Everything arrives scored on the same six factors, so the numbers are comparable across whatever you loaded.

    2

    Read the model, not just the rank

    Every grade opens up into the inputs behind it. Where data was missing, the model says so rather than quietly filling the gap.

    3

    Track what you act on

    Add positions to a portfolio and the same engine keeps scoring them — with cost basis, concentration and correlation alongside.

    Anywhere

    Works on whatever you have open

    One responsive web app — nothing to install, and your account carries your portfolios between devices.

    🖥️Desktop
    💻Laptop
    📱Mobile

    Score a name, then scan its chain

    Start with a handful of tickers and see the whole workflow in about a minute. An account is only needed when you want to save positions.

    Tradesify · Stock Scorecard

    Ticker → Scorecard

    Type a ticker or a list of tickers below. Each is scored on a six-category weighted fundamental model plus an EMA/RSI technical structure read. Data is fetched live via AI-powered web search — no API key needed on your end.

    Not financial advice. Tradesify is a screening and research tool, not investment advice or a recommendation to buy or sell any security.

    Dow Jones——
    Nasdaq Comp——
    S&P 500——
    Russell 2000——
    Loading today's market…

    Enter ticker(s)

    Comma or space separated · e.g. AAPL, MSFT, NVDA · already have a list loaded? Type more and click Fetch & Score again to add them — use the × on a row to remove one.

    Data fetched live via yfinance (Yahoo Finance) — local backend required.

    Fetching live data…

    Reaching out to Yahoo Finance…

    Weights
    click headers to sort · click ticker to expand
    # Ticker Company Price Mkt Cap % 1D Score Comp ▾ Bear–Bull P/E D-RSI Posture Daily Weekly % YTD Chart 1Y % 1Y △ Highs 20 50 200
    How it scores. Each category is built from sub-metrics scored on absolute threshold bands, weighted to the maxes above, plus an RSI timing modifier added to the fundamental total. Fund is shown as % of the maximum the model can award, so it means the same thing in every batch — it no longer moves when you add or remove other tickers. Tech (0–100) blends EMA structure (price vs 20/50/200), posture, an RSI quality band, relative strength, and an extension penalty. Composite = Fund% × your fund weight + Tech × your tech weight. Score is the headline number: fundamentals (60%) blended with the price trend (40%), computed on the server so this page and the stock page always show the same figure for a ticker. Hover the Score badge and open either half for the factors behind it — Fundamentals scores revenue and earnings growth, ROE, margins, P/E, debt and 6-month momentum against fixed absolute bands (A 80+, B 65, C 50, D 35), while Price trend reads moving averages, posture, RSI and extension with no fundamentals in it (graded on the technical card's own stricter A 90+ scale). The dot on the badge flags how far the two disagree: a 60 built from 62/57 is a very different stock from a 60 built from 88/18, and one number cannot say which. If only one half can be scored the Score renormalises onto it and shows a ½ mark rather than counting the gap as zero. Bear–Bull re-scores the composite under shocked assumptions (bear: growth −10pp & margins −300bps; bull: +6pp & +200bps) with valuation, smart money and the technical read held constant — expand any ticker to run custom shocks. Not financial advice.

    One ticker, straight to the page

    Look up a stock.

    Type a symbol and press Enter. No list, no scoring run, no waiting — you land on that company's page with its chart, fundamentals and peers.

    One symbol at a time. Indices like ^GSPC, futures like GC=F and pairs like BTC-USD all work.

    Or start with one of these

    ChartCandles back to the first traded bar, with overlays, indicators and pattern marks. Pop it out for drawing tools.
    Reported fundamentalsGAAP EPS, sales and share count, annual or quarterly, straight from the filings.
    Live peersSame-industry comparables ranked by size, with today's move on each.
    HoldingsFor an ETF or fund: sector breakdown and its largest positions as a heat map.
    Loading chart…

    Metrics

    Hover any name for its definition
    Quote and fundamentals via yfinance · fundamentals cached for 10 minutes · for research, not investment advice

    Tradesify · ETFs

    ETF → Industries

    585 industry ETFs across 79 groups, leveraged and inverse funds excluded. Click any group to load its funds into the Stock Scorecard — scored by the same engine as any stock, with ranking, charts, scatter and stats over the lot. Nothing is fetched until you open a group.

    Tradesify · Themes

    Theme → Baskets

    Curated thematic baskets, scored by the full engine. Click any theme to load its tickers into the screener — ranking, watchlist, scatter, stats and heatmap, with a one-click PNG export.

    Tradesify · Sectors

    Stock Market → Sectors

    Live S&P 500 sector performance with expandable industry breakdowns. Data updates on page load via Yahoo Finance.

    Period:
    Sector
    Last
    Today
    Price Range
    ⏳
    Loading sector data…

    Data via yfinance through the local Flask server. Sector ETFs used as proxies: XLRE, XLV, XLU, XLE, XLI, XLF, XLB, XLK, XLP, XLY, XLC.

    Tradesify · Groups

    Sector → Groups

    The 11 S&P 500 sectors ranked by performance across every timeframe at once, using SPDR sector ETFs as proxies.

    Sector Performance — Ranked

    Green = gain, maroon = loss; bar length shows the size of the move. Every timeframe loads at once.

    Loading sector performance…

    Data via yfinance through the local Flask server. Sector ETF proxies: XLB, XLC, XLY, XLP, XLE, XLF, XLV, XLI, XLRE, XLK, XLU.

    Tradesify · Funds

    ETF → Heatmap

    Every fund that matters on one board, coloured by its move over the window you pick — US sectors, factors, bonds, commodities and leverage on one tab, and the world on the other. Click a tile for its full chart, or turn on Compare to put several on one.

    Performance from Yahoo Finance via yfinance, on daily closes. 3Y and 5Y are blank for a fund younger than the window rather than measured from its first day. Not financial advice.

    Tradesify · Funds

    ETF → Bar Charts

    One fund per category to stand for it — charted on any timeframe from one minute to the whole history, with RSI, Cipher B and volume underneath. Add or drop any fund you like.

    Charting
    Filters

    Every fund, by category

    RSI and Cipher B for each one. Pick a category to load it — they are fetched on demand rather than all at once.

    Candles and indicators via yfinance (Yahoo Finance). Intraday history is capped at source — one minute reaches back about a week, the other intraday steps about two months. Cipher B blanks its first bars while WaveTrend warms up.

    Tradesify · Funds

    ETF → Compare ETFs

    Up to five funds on one rebased line, so the question stops being “how did each one do” and becomes “which one did better, and when did that change”. Underneath: the figures side by side, and every calendar year separately — because a fund that wins over ten years can still have lost badly in three of them.

    Comparing
    Try

    Total return, rebased

    Loading…

    Side by side

    Live from the same source as the rest of the app. A blank cell means the figure does not exist for that fund rather than that it is zero.

    Year by year

    Calendar-year price returns, worked out from the monthly closes. The current year is incomplete and marked as such.

    Tradesify · Funds

    ETF → Providers

    Who actually runs the fund. Two ETFs tracking the same index can differ by more than their fee — in how they sample it, how they lend the stock out and how wide the spread gets on a bad morning — and that comes down to the house. Pick one to see every fund of theirs Tradesify tracks, priced live.

    Tradesify · Research

    Fundamental → Chart

    The business, not the share price. Plot any line from the income statement, balance sheet or cash flow — or a margin, a ratio, or the growth rate of any of them — across as many years as the filings go back. Put two on the same axes when the relationship is the point: revenue against cost of revenue, operating cash flow against capex.

    Tradesify · Research

    Stock → Compare

    Up to five companies on one rebased line, then the figures that explain the gap: what they earn, what they keep, what you pay for it and how much debt sits underneath. Two names in the same industry rarely differ by one number, which is why this is a table and not a verdict.

    Comparing
    Try

    Total return, rebased

    Side by side

    Live, from the same source as the rest of the app. A blank cell means the figure does not exist for that company rather than that it is zero.

    Year by year

    Calendar-year price returns from the monthly closes. The current year is incomplete and marked as such.

    Tradesify · Tools

    Calculators

    Four pieces of arithmetic worth doing before you act on a number someone quoted at you. None of them touch the network — they work on what you type, which also means they work when the market data does not.

    Compound annual growth rate

    Turns “it went from X to Y over N years” into one rate you can compare against anything else. Total return flatters long holdings; CAGR is what actually stands up next to a savings rate.

    Dividend income

    What a position actually pays, and what it becomes if the dividend grows and you reinvest it. The second number is usually the surprising one.

    Discounted cash flow

    A two-stage DCF: cash flow grows at one rate for the forecast period, then at a slower rate forever. It is a sensitivity tool, not an oracle — move the discount rate a point and watch the answer move twenty percent. That sensitivity is the output worth having.

    Position size

    Work back from what you are willing to lose rather than forward from what you want to own. The stop decides the size; the conviction decides the stop.

    These are arithmetic, not advice. Every one of them is only as good as what you put into it, and the ones with a growth rate in them are assumptions wearing a decimal point.

    Tradesify · Markets

    Market → Movers

    What ran and what broke today, with the breadth underneath it — because one name up nine percent and four hundred down is a different day from one name up nine percent and four hundred up with it. Ranked from the large-cap universe the app already keeps warm, so looking at this costs the quote source nothing.

    Tradesify · Status

    Self-check

    Every endpoint the app depends on, called for real and timed. It exists to tell apart the three failures that look identical from a blank page: the server is down, the server is up but the quote source is refusing it, or everything works and is merely slow. Each check says what it expected and whether it got it.

    A failing row does not mean the page that uses it is broken — it means that page will show the reason and a retry button instead of content. Nothing in this app waits forever on a request any more.

    Tradesify · Help

    Help → Centre

    Guides and answers for what Tradesify does. If something is not covered here, it is probably because the app does not do it.

    Nothing in Tradesify is financial advice. Scores, grades and signals summarise public data under a fixed rubric; they are not recommendations and they know nothing about your circumstances.

    Tradesify · Funds

    ETF → Scorecard

    Grades a fund three ways: the AI Rating of every holding it discloses, weighted by position size; the fund’s own price trend; and the wrapper itself — cost, tradability, size and concentration. Enter one ETF or several to compare.

    Try:

    Tradesify · Options

    Option → Chain

    Scans the full chain for one ticker, prices every contract with Black‑Scholes, and ranks long calls and puts by liquidity, breakeven reachability, decay drag and value vs realized volatility.

    Long options can go to zero. Every candidate below has a max loss of 100% of the premium paid, and most expire worthless. Probabilities shown are model estimates from implied volatility, not forecasts. This is a research screen, not a recommendation to trade — size positions accordingly.
    Filters changed — click Apply

    Enter a ticker and hit Scan chain to pull its options.

    Tradesify · Leaderboard

    Public → Scorecards

    What other traders published — screens they ran and books they hold, ranked separately because they are different claims. Each entry leads with whichever figure the board is ranked by, and the bar under it shows how that figure compares to the leader.

    Tradesify · Copytrade

    Live → Books

    Portfolios that publish themselves. A leaderboard scorecard is a snapshot and goes stale the moment its author trades; a Copytrade book tracks the live portfolio and records every change, so you can see what moved and when — not just where it ended up. Positions are published as percentage weights, never dollar amounts.

    Tradesify · Portfolio

    Your → Positions

    A watchlist tracks what you're curious about. This tracks what you actually own — cost basis, unrealized P&L, concentration, and whether the scoring engine still likes what you're holding. Keep as many separate books as you need; each one gets its own address, cash balance and notes.

    🤖 AI Portfolio

    Re-allocate this book by rating, flag what to close, and find better-rated names in the same industries. Nothing is bought or sold.

    View The screener re-scores the whole book. Charts and ratings open in an overlay.

    Holdings

    # Ticker Rating Company Shares Avg. Cost Total Cost Price Change % Volume Market Value Change $ Total Gain % Total Gain $
    How this works. Shares and average cost are yours; everything else is computed live. Hover any figure in the summary strip for its definition. Market Value = shares × last price. Total Gain is unrealized, measured against your cost basis, and ignores dividends, fees and taxes. Change $ is today's dollar move on the whole position, not per share. Adding a ticker you already hold blends into a weighted average cost rather than opening a second lot — the same ticker in a different portfolio stays a separate position. Cash holdings count toward total value and the allocation donuts, and are deliberately kept out of market value, cost, gain, today's move and the weighted score. The holdings value chart prices today's share counts at historical closes, so it shows how this basket has behaved rather than what your account balance actually was — that would need a record of when each lot was bought. Option contracts are valued at the chain mid (or the last trade when there is no two-sided market) and their Greeks come from the same Black–Scholes engine the Option Chain page uses, so a contract you hold is priced the way it was priced before you bought it. Greeks are shown in position terms — already multiplied by contracts and the multiplier, and already signed by side. Share-equivalent exposure is delta × 100 × contracts: directional risk as of today, which moves as the underlying does. Look-through decomposes any fund you hold into its published top holdings; whatever those do not cover stays visible as a remainder rather than being quietly dropped. The technical grade reads trend and momentum only (21/50/200 EMA on the daily and the weekly, plus RSI) and sits beside the composite score rather than being folded into it. Prices come from Yahoo Finance and can lag; this is not a brokerage statement, and nothing here is financial advice.

    Tradesify · Industry Heat Map

    Industry → Heat Map

    Every tracked industry, colored by its sector ETF proxy for an instant overview. Pick a window, then click any industry to load its member stocks — full scores, charts, and ticker list — in the Screener.

    Window:

    Strong gain Gain Near flat Slight loss Loss Strong loss

    Terms of Service & Disclaimer

    Tradesify (tradesify.io) · Last updated June 28, 2026

    1. Acceptance of Terms

    By accessing or using Tradesify (the "Service") — including any scores, grades, ratings, rankings, charts, screeners, themes, heat maps, or data it provides — you agree to be bound by these Terms of Service and Disclaimer ("Terms"). Your use of the Service constitutes automatic and binding acceptance of these Terms. If you do not agree, do not use the Service. You acknowledge that you should read these Terms in full before using the Service to make, or to assist in making, any investment decision.

    2. Not Financial Advice

    Tradesify is an informational and educational tool only. Nothing on the Service is, or should be construed as, financial, investment, trading, legal, tax, or accounting advice, or as a recommendation, endorsement, offer, or solicitation to buy, sell, or hold any security, option, or other financial instrument. Tradesify is not a registered investment adviser, broker-dealer, or financial planner, and no fiduciary or advisory relationship is created by your use of the Service. Always consult a licensed financial professional before investing.

    3. AI- and Model-Generated Content

    Much of the content on the Service — including scores, grades, ratings, rankings, screens, summaries, and other analysis — is generated automatically by artificial intelligence and quantitative models. These ratings are AI-generated, are not professional judgments, and may contain errors, omissions, flawed assumptions, or inaccuracies. They are provided for general informational purposes only and must not be relied upon as a basis for any financial decision.

    4. Do Your Own Research

    You are solely responsible for your own investment decisions. You must independently verify any information and conduct your own research and due diligence before acting on anything you see on the Service. Any reliance you place on the Service is strictly at your own risk.

    5. Data Sources & Accuracy

    Market and fundamental data are pulled from third-party sources, primarily Yahoo Finance via the open-source "yfinance" library. This data may be delayed, outdated, incomplete, inaccurate, or unavailable, and may differ from official or real-time sources. Tradesify does not create, verify, endorse, or guarantee the accuracy, completeness, or timeliness of any data, and is not affiliated with, sponsored by, or endorsed by Yahoo, Yahoo Finance, or any data provider. Your use of third-party data is also subject to those providers' own terms.

    6. No Warranties

    The Service is provided "as is" and "as available," without warranties of any kind, express or implied, including merchantability, fitness for a particular purpose, accuracy, or non-infringement. We do not warrant that the Service will be uninterrupted, error-free, secure, or available at any time, and we may modify, suspend, or discontinue any part of it at any time without notice.

    7. Investment Risk

    All investing and trading involves substantial risk, including the possible loss of your entire principal. Options and other derivatives are especially high-risk and are not suitable for all investors. Past performance is not indicative of future results, and any forward-looking information is inherently speculative.

    8. Limitation of Liability

    To the maximum extent permitted by law, Tradesify and its owner(s), operators, and affiliates are not liable for any loss of money, funds, profits, capital, time, or data, nor for any direct, indirect, incidental, special, consequential, or punitive damages, arising out of or related to your use of (or inability to use) the Service or any reliance on its content or data — even if advised of the possibility of such damages. If you lose money, that is your sole responsibility, and you use the Service entirely at your own risk.

    9. Indemnification

    You agree to indemnify and hold harmless Tradesify and its owner(s), operators, and affiliates from any claims, losses, liabilities, or expenses (including reasonable legal fees) arising from your use of the Service or your violation of these Terms.

    10. Eligibility

    You represent that you are at least 18 years old (or the age of majority in your jurisdiction) and legally able to enter into these Terms.

    11. Intellectual Property

    The Service, its design, scoring methodology, and original content are the property of Tradesify and may not be copied, redistributed, or used commercially without permission. Third-party data and trademarks remain the property of their respective owners.

    12. Changes to These Terms

    We may update these Terms at any time. Changes are effective when posted, and your continued use of the Service constitutes acceptance of the revised Terms.

    13. Governing Law & Severability

    These Terms are governed by the laws of the State of Illinois, USA, without regard to conflict-of-law principles. If any provision is found unenforceable, the remaining provisions remain in full effect.

    14. Contact

    Questions about these Terms may be directed to the Tradesify operator at the contact address listed on the site.

    By using Tradesify, you acknowledge that you have read, understood, and agreed to these Terms of Service and Disclaimer. This is not financial advice.

    This document is a general template and not legal advice. Replace the governing-law jurisdiction and contact details with your own, and have a licensed attorney review it before relying on it.

    Sign in

    Welcome back to Tradesify.